More on node operation and configuration
Start Node
Run docker-compose up.
$ docker-compose up -dThe docker ps command shows the list of running docker containers.
$ docker ps
CONTAINER ID   IMAGE                                                          COMMAND                CREATED              STATUS                          PORTS                                                                 NAMES
0de99e33cdc9     iconloop/prep-node:1910261021xc97f33    "/src/entrypoint.sh"      2 minutes ago        Up 2 minutes(healthy)    0.0.0.0:7100->7100/tcp, 0.0.0.0:9000->9000/tcp prep_prep_1
Corresponding columns,
| Column | Description |
|---|---|
| CONTAINER ID | Container ID |
| IMAGE | P-Rep Node's image name |
| COMMAND | The script will be executed whenever a P-Rep Node container is run |
| STATUS | Healthcheck status. One of "starting" , "healthy", "unhealthy" or "none" |
| PORTS | Exposed ports on the running container |
| NAMES | Container name |
You can read the container booting log from the log folder.
$ tail -f data/PREP-MainNet/log/booting_20190419.log
[2019-10-28 10:43:05.204] Your IP: xx.xx.xx.xx
[2019-10-28 10:43:05.209] RPC_PORT: 9000 / RPC_WORKER: 3
[2019-10-28 10:43:05.214] DEFAULT_PATH=/data/mainnet in Docker Container
[2019-10-28 10:43:05.219] DEFAULT_LOG_PATH=/data/mainnet/log
[2019-10-28 10:43:05.224] DEFAULT_STORAGE_PATH=/data/mainnet/.storage
[2019-10-28 10:43:05.229] scoreRootPath=/data/mainnet/.score_data/score
[2019-10-28 10:43:05.234] stateDbRootPath=/data/mainnet/.score_data/db
[2019-10-28 10:43:05.239] Time synchronization with NTP / NTP SERVER: time.google.com
[2019-10-28 10:43:12.022] P-REP package version info - _1910261021xc97f33
[2019-10-28 10:43:12.853] iconcommons 1.1.2
iconrpcserver 1.4.5
iconsdk 1.2.0
iconservice 1.5.15
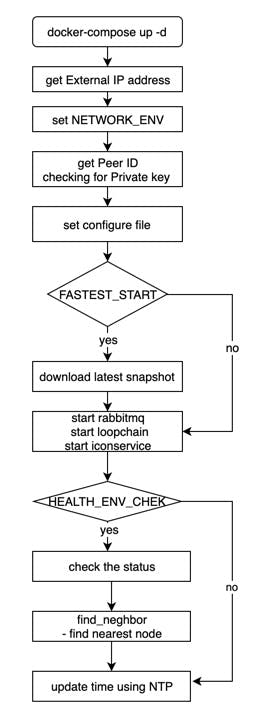
loopchain 2.4.16Entrypoint.sh Diagram
Stop Node
$ docker-compose downView Node Status
Check the current state and information of the prep-node
API Checks
The current state of a node can be confirmed by /api/v1/status/peer and /api/v1/avail/peer API functions. The response data are the same, but HTTP response codes are different.
$ curl localhost:9000/api/v1/status/peer

{
  "made_block_count": 0,
  "leader_made_block_count": 7,
  "status": "Service is online: 0",
  "state": "Watch",
  "service_available": true,
  "peer_type": "0",
  "audience_count": "0",
  "consensus": "siever",
  "peer_id": "hx72bff0f887ef183bde1391dc61375f096e75c74a",
  "block_height": 10106994,
  "round": 0,
  "epoch_height": 10106995,
  "unconfirmed_block_height": -1,
  "total_tx": 72003516,
  "unconfirmed_tx": 0,
  "peer_target": "xxx.xxx.xxx.xxx:7100",
  "leader_complaint": 1,
  "peer_count": 24,
  "leader": "hxc9e36a98a3fca0b636eb822ff5a96db658e4bb88",
  "epoch_leader": "hxc9e36a98a3fca0b636eb822ff5a96db658e4bb88",
  "versions": {
    "loopchain": "2.4.16",
    "iconservice": "1.5.15",
    "iconrpcserver": "1.4.5",
    "iconcommons": "1.1.2",
    "earlgrey": "0.0.4"
  },
  "mq": {
    "peer": {
      "message_count": 0
    },
    "channel": {
      "message_count": 0
    },
    "score": {
      "message_count": 0
    }
  }
}/api/v1/avail/peerreturns HTTP response 503 when the service is unavailable
This is useful when performing a health check based on the HTTP response code of the load balancer.
#Return HTTP 503 Service Unavailable

state : InitComponents, EvaluateNetwork, BlockSync, SubscribeNetwork/api/v1/status/peerreturns 200 OK at BlockSync
$ curl -i localhost:9000/api/v1/status/peer
HTTP/1.1 200 OK
Connection: close
Access-Control-Allow-Origin: *
Content-Length: 573
Content-Type: application/json

{
  "made_block_count": 0,
  "leader_made_block_count": 7,
  "status": "Service is online: 0",
  "state": "Watch",
  "service_available": true,
  "peer_type": "0",
  "audience_count": "0",
  "consensus": "siever",
  "peer_id": "hx72bff0f887ef183bde1391dc61375f096e75c74a",
  "block_height": 10106994,
  "round": 0,
  "epoch_height": 10106995,
  "unconfirmed_block_height": -1,
  "total_tx": 72003516,
  "unconfirmed_tx": 0,
  "peer_target": "xxx.xxx.xxx.xxx:7100",
  "leader_complaint": 1,
  "peer_count": 24,
  "leader": "hxc9e36a98a3fca0b636eb822ff5a96db658e4bb88",
  "epoch_leader": "hxc9e36a98a3fca0b636eb822ff5a96db658e4bb88",
  "versions": {
    "loopchain": "2.4.16",
    "iconservice": "1.5.15",
    "iconrpcserver": "1.4.5",
    "iconcommons": "1.1.2",
    "earlgrey": "0.0.4"
  },
  "mq": {
    "peer": {
      "message_count": 0
    },
    "channel": {
      "message_count": 0
    },
    "score": {
      "message_count": 0
    }
  }
}/api/v1/avail/peerreturns 503 OK at BlockSync
$ curl -i localhost:9000/api/v1/avail/peer
HTTP/1.1 503 Service Unavailable
Connection: close
Access-Control-Allow-Origin: *
Content-Length: 573
Content-Type: application/json

{
  "made_block_count": 0,
  "leader_made_block_count": 7,
  "status": "Service is online: 0",
  "state": "Watch",
  "service_available": true,
  "peer_type": "0",
  "audience_count": "0",
  "consensus": "siever",
  "peer_id": "hx72bff0f887ef183bde1391dc61375f096e75c74a",
  "block_height": 10106994,
  "round": 0,
  "epoch_height": 10106995,
  "unconfirmed_block_height": -1,
  "total_tx": 72003516,
  "unconfirmed_tx": 0,
  "peer_target": "xxx.xxx.xxx.xxx:7100",
  "leader_complaint": 1,
  "peer_count": 24,
  "leader": "hxc9e36a98a3fca0b636eb822ff5a96db658e4bb88",
  "epoch_leader": "hxc9e36a98a3fca0b636eb822ff5a96db658e4bb88",
  "versions": {
    "loopchain": "2.4.16",
    "iconservice": "1.5.15",
    "iconrpcserver": "1.4.5",
    "iconcommons": "1.1.2",
    "earlgrey": "0.0.4"
  },
  "mq": {
    "peer": {
      "message_count": 0
    },
    "channel": {
      "message_count": 0
    },
    "score": {
      "message_count": 0
    }
  }
}
Node Status Detail
| value name | Description | Reason or allowed value |
|---|---|---|
| made_block_count | number of block generated by node | Reset when node became a leader after a rotation or reorerated. |
| status | service on / off status | "Service is online: 1" : Working (leader status)"Service is online: 0" : Working (not a leader status)"Service is offline: block height sync" : block sync condition"Service is offline: mq down" ": channel mq issue |
| state | node condition | detailed information (display at bottom) |
| service_available | service condition | [ true / false ] |
| peer_type | classify leader node and verifying node | "0" : verifying node"1" : leader node |
| audience_count | DEPRECATION, It will be remove | |
| consensus | consensus algorithm | "siever" : current consensus algorithm"LFT" : consensus algorithm that will adapt in the future |
| peer_id | unique address of node | 40 digit HEX string |
| block_height | Current block height of node | |
| round | number of counts for current block consensus process | The count increases by one when leader node fails to process transaction and leader complaint is occured or consensus is failed. The count reset when block generation is complete |
| epoch_height | block heights of processing block. In case of citizen nodes, their block heights stop at SubscribeNetwork block heights because they don’t participate in consensus. | |
| unconfirmed_block_height | block heights of unprocessed block | same as epoch_height |
| total_tx | Total number of tx until current block | |
| unconfirmed_tx | number of unprocessed tx that hold by queueif it holds by leader more than one minute leader complaint will occur | |
| peer_target | IP address and port of node | "IP:PORT" |
| leader_complaint | DEPRECATION, It will be remove | |
| peer_count | total number of nodes in blockchain network | |
| leader | Unique address of a leader node | 40 digit HEX string |
| epoch_leader | Unique address of a leader node in consensus process | 40 digit HEX string |
| mq.peer.message_count | Accumulated number of messages in pier MQ | Presents ‘-1’ when an error occurs and details can be found in "error" |
| mq.channel.message_count | Accumulated number of messages in channel MQ | Presents ‘-1’ when an error occurs and details can be found in "error" |
| mq.score.message_count | Accumulated number of messages in SCORE MQ | Presents ‘-1’ when an error occurs and details can be found in "error" |
State Detail
| State Value | Description |
|---|---|
| InitComponents | Channel Service initial state |
| Consensus | Loopchain Consensus begins. Convert to BlockHeightSync automatically |
| BlockHeightSync | Block height Sync state begins. Convert to EvaluateNetwork automatically |
| EvaluateNetwork | Evaluate the BlockSync state by checking the network status |
| BlockSync | Block Sync loop. |
| SubscribeNetwork | Determine the type depending on the node type. A citizen node requests the block generation message to a parent node. |
| Watch | Citizen node default state. Relay transaction and sync the blocks created by a parent node |
| Vote | Status of validating and voting blocks created by the leader |
| LeaderComplain | Status of requesting leader complain for current leader and wait for complain |
| BlockGenerate | Status of leader creating a block |
| GracefulShutdown | End Process |
Docker Environment Variables
version: '3'
services:
  icon2-node:
    image: 'iconloop/icon2-node'
    restart: "on-failure"
    container_name: "icon2-node"
    network_mode: "host"
    stdin_open: true
    environment:
      SERVICE: "MainNet"  # MainNet, SeJong
      #IS_AUTOGEN_CERT: "true"
      GOLOOP_LOG_LEVEL: "debug" # trace, debug, info, warn, error, fatal, panic
      KEY_STORE_FILENAME: "INPUT_YOUR_KEY_STORE_FILENAME" # e.g. keystore.json read a config/keystore.json
      KEY_PASSWORD: "INPUT_YOUR_KEY_PASSWORD" # e.g. "/goloop/config/keystore.json" read a "config/keystore.json" of host machine
      FASTEST_START: "true"    # It can be restored from latest Snapshot DB.
      ROLE: 3 # preps = 3, citizen = 0

    cap_add:
      - SYS_TIME

    volumes:
      - ./config:/goloop/config
      - ./data:/goloop/data
      - ./logs:/goloop/logs
The P-Rep Node image supports the following environment variables:
| Environment variable | Description | Default value | Allowed value | |
|---|---|---|---|---|
| IPADDR | Setting the IP address | $EXT_IPADDR | ||
| LOCAL_TEST | false | false | ||
| NETWORK_ENV | Network Environment name | PREP-TestNet | mainnet, PREP-TestNet | |
| SERVICE | Service Name | default | ||
| SERVICE_API | SERVICE_API URI | https://${SERVICE}.net.solidwallet.io/api/v3 (opens in a new tab) | URI | |
| ENDPOINT_URL | ENDPOINT API URI | https://${SERVICE}.net.solidwallet.io (opens in a new tab) | URI | |
| NTP_SERVER | NTP SERVER ADDRESS | time.google.com | ||
| NTP_REFRESH_TIME | NTP refresh time | 21600 | ||
| FIND_NEIGHBOR | Find fastest neighborhood PRrep | false | ||
| DEFAULT_PATH | Setting the Default Root PATH | /data/${NETWORK_ENV} | ||
| DEFAULT_LOG_PATH | Setting the logging path | ${DEFAULT_PATH}/log | ||
| DEFAULT_STORAGE_PATH | block DB will be stored | ${DEFAULT_PATH}/.storage | ||
| USE_NAT | if you want to use NAT Network | no | ||
| NETWORK_NAME | ||||
| VIEW_CONFIG | for check deployment state | false | boolean (true/false) | |
| USE_MQ_ADMIN | Enable RabbitMQ management Web interface.The management UI can be accessed using a Web browser at http://{node-hostname}:15672/ (opens in a new tab) | false | boolean (true/false) | |
| MQ_ADMIN | RabbitMQ management username | admin | ||
| MQ_PASSWORD | RabbitMQ management password | iamicon | ||
| LOOPCHAIN_LOG_LEVEL | loopchain log level | INFO | DEBUG, INFO, WARNING, ERROR | |
| ICON_LOG_LEVEL | iconservice log level | INFO | DEBUG, INFO, WARNING, ERROR | |
| LOG_OUTPUT_TYPE | loopchain's output log type | file | file, console | |
| outputType | iconservice's output log type | $LOG_OUTPUT_TYPE | file, console | |
| CONF_PATH | Setting the configure file path | /${APP_DIR}/conf | ||
| CERT_PATH | Setting the certificate key file path | /${APP_DIR}/cert | ||
| REDIRECT_PROTOCOL | http | http | ||
| SUBSCRIBE_USE_HTTPS | false | false | ||
| ICON_NID | Setting the ICON Network ID number | 0x50 | ||
| ALLOW_MAKE_EMPTY_BLOCK | false | false | ||
| score_fee | true | true | ||
| score_audit | false | false | ||
| scoreRootPath | ${DEFAULT_PATH}/.score_data/score | ${DEFAULT_PATH}/.score_data/score | ||
| stateDbRootPath | ${DEFAULT_PATH}/.score_data/db | ${DEFAULT_PATH}/.score_data/db | ||
| iissDbRootPath | ${DEFAULT_PATH}/.iissDb | ${DEFAULT_PATH}/.iissDb | ||
| CHANNEL_BUILTIN | boolean (true/false) | true | ||
| PEER_NAME | uname | uname | ||
| PUBLIC_PATH | public cert key location | ${CERT_PATH}/${IPADDR}_public.der | ||
| PRIVATE_PATH | private cert key location | ${CERT_PATH}/${IPADDR}_private.der | ||
| PRIVATE_PASSWORD | private cert key password | test | ||
| LOAD_PEERS_FROM_IISS | true | true | ||
| CHANNEL_MANAGE_DATA_PATH | ${CONF_PATH}/channel_manange_data.json | ${CONF_PATH}/channel_manange_data.json | ||
| CONFIG_API_SERVER | https://download.solidwallet.io (opens in a new tab) | https://download.solidwallet.io (opens in a new tab) | ||
| GENESIS_DATA_PATH | ${CONF_PATH}/genesis.json | ${CONF_PATH}/genesis.json | ||
| BLOCK_VERSIONS | ||||
| NEXT_BLOCK_VERSION_HEIGHT | ||||
| FORCE_RUN_MODE | Setting the loopchain running parameter e.g. if FORCE_RUN_MODE is | |||
| configure_json | ${CONF_PATH}/configure.json | ${CONF_PATH}/configure.json | ||
| iconservice_json | ${CONF_PATH}/iconservice.json | ${CONF_PATH}/iconservice.json | ||
| iconrpcserver_json | ${CONF_PATH}/iconrpcserver.json | ${CONF_PATH}/iconrpcserver.json | ||
| ICON_REVISION | 4 | 4 | ||
| ROLE_SWITCH_BLOCK_HEIGHT | 1 | 1 | ||
| mainPRepCount | 22 | 22 | ||
| mainAndSubPRepCount | 100 | 100 | ||
| decentralizeTrigger | 0.002 | 0.002 | ||
| RPC_PORT | Choose a RPC service port | 9000 | ||
| RPC_WORKER | Setting the number of RPC workers | 3 | ||
| RPC_GRACEFUL_TIMEOUT | rpc graceful timeout | 0 | ||
| PRIVATE_KEY_FILENAME | YOUR_KEYSTORE or YOUR_CERTKEY FILENAME | FileName | ||
| PRIVATE_PASSWORD | YOUR_KEY_PASSWORD | String |
Troubleshooting
Q: How to check if a container is running or not?
The docker ps command shows the list of running docker containers.
$ docker ps
CONTAINER ID   IMAGE                                                          COMMAND                CREATED              STATUS                          PORTS                                                                 NAMES
0de99e33cdc9     iconloop/prep-node:1910261021xc97f33    "/src/entrypoint.sh"      2 minutes ago        Up 2 minutes(healthy)    0.0.0.0:7100->7100/tcp, 0.0.0.0:9000->9000/tcp prep_prep_1
You should look under the STATUS field to see if the container is up and in healthy state.
Inside the container, there is a healthcheck script running with the following configuration. It will return unhealthy when it fails.
| Healthcheck option | value |
|---|---|
| retries | 4 |
| interval | 30s |
| timeout | 20s |
| start-period | 60s |
The container can have three states:
- starting - container just starts
- healthy - when the health check passes
- unhealthy - when the health check fails
If the container does not start properly or went down unexpectedly, please check the booting.log. Below is the log messages on success.
$ cat data/PREP-MainNet/log/booting_${DATE}.log

[2019-10-28 10:43:05.204] Your IP: xxx.xxx.xxx.xxx
[2019-10-28 10:43:05.209] RPC_PORT: 9000 / RPC_WORKER: 3
[2019-10-28 10:43:05.214] DEFAULT_PATH=/data/mainnet in Docker Container
[2019-10-28 10:43:05.219] DEFAULT_LOG_PATH=/data/mainnet/log
[2019-10-28 10:43:05.224] DEFAULT_STORAGE_PATH=/data/mainnet/.storage
[2019-10-28 10:43:05.229] scoreRootPath=/data/mainnet/.score_data/score
[2019-10-28 10:43:05.234] stateDbRootPath=/data/mainnet/.score_data/db
[2019-10-28 10:43:05.239] Time synchronization with NTP / NTP SERVER: time.google.com
[2019-10-28 10:43:12.022] P-REP package version info - _1910261021xc97f33
[2019-10-28 10:43:12.853] iconcommons             1.1.2
iconrpcserver           1.4.5
iconsdk                 1.2.0
iconservice             1.5.15
loopchain               2.4.16
Q: How to locate errors from logs?
Error log messages example
Grep the ERROR messages from the log files to find the possible cause of the failure.
$ cat data/PREP-MainNet/log/booting_${DATE}.log | grep ERROR

[2019-08-12 02:08:48.746] [ERROR] Download Failed - http://20.20.1.149:5000/cert/20.20.1.195_public.der status_code=000

[2019-08-12 01:58:46.439] [ERROR] Unauthorized IP address, Please contact our support team
Docker container generates these log files below
booting.log
- The log file contains the errors that occurred when the docker container starts up.
iconrpcserver.log
- The log file contains information about the request/response message handling going through the iconrpcserver.
iconservice.log
- The log file contains the internals of ICON Service
loopchain.channel-txcreator-icon_dex_broadcast.icon_dex.log
- The log file contains information about TX broadcast from a node to other nodes
loopchain.channel-txcreator.icon_dex.log
- The log file contains information about the process of confirming TXƒ
loopchain.channel-txreceiver.icon_dex.log
- The log file contains information about receiving the broadcasted TX from a node.
loopchain.channel.icon_dex.log
- The log file contains information about internals of loopchain engine
Q: How to monitor different resources?
We recommend the following tools for resource monitoring
- Network monitoring -
iftop,nethogs,vnstat - CPU/Memory monitoring -
top,htop - Disk I/O monitoring -
iostat,iotop - Docker monitoring -
docker stats,ctop